

During a crisis having the most accurate, timely information possible is essential. Sharing detailed, real-time data helps provide the public with a clearer view of the virus in our community. However, this data and information is only as valuable as our community’s understanding of it. In order to effectively represent the current threat of coronavirus in our area, the City of Chattanooga is providing several tools to help interpret local and regional data. We hope these tools and resources will help inform residents and allow them to make the best decisions to keep their friends and family safe.


'Making sense of COVID related data can be confusing. What does the daily numbers mean and how should you interpret them? The Harvard Global Health Initiative has provided a framework for understanding COVID risk and suggests targets for mitigating or suppressing outbreaks. The current COVID Risk Score and criteria are shown at the top of this section. The COVID Risk Score and below visuals all come from the data provided by Hamilton County Health Department. You can view additional visuals and download the data collected from the Health Departments website on this local COVID dashboard run by Jesse Houser.
On any given day the numbers can change quite dramatically from the previous day. How do you make sense of all this day to day changing? When looking at the data it is important to look at the overall trend of the day. Are the cases increasing or decreasing? How rapidly are cases increasing or decreasing? One way to help remove all the noise from the day to day change is to use the 7 day moving average. While it sounds complex it is fairly simple. The seven day moving average is just the average number of cases (total number of cases divided by the seven days) over the past seven days. Most of the visuals below use this approach to more clearly show the trend.

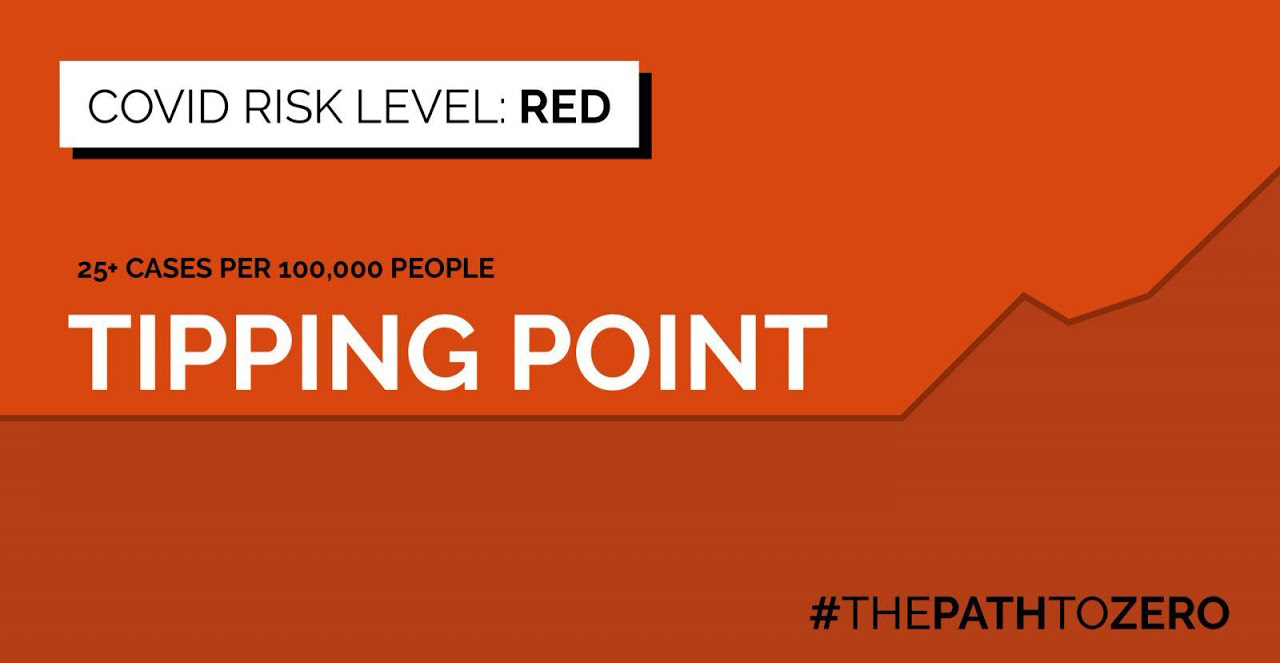
Knowing when to open and when to close our facilities during a global pandemic is not a straightforward task. The decision can vary based on what is being opened or closed as well as what we see in how the virus is impacting our community. Currently there is no clear guidance on when to open and when to close from the federal government or public health institutions. As a result, there are often several different standards within the same community. This can make understanding risk and when to open and close very confusing.
To help make this easier to understand, the City of Chattanooga created a simple stop/go graphic to let the community know how city officials determine whether to open or close facilities.
We based the stop/go graphic on the framework laid out by the experts at the Harvard Global Health Initiative. You can read more about the framework above.
When we are in the red, city facilities are closed. There is a very high risk of community spread and we need to shut down to reduce the cases. Reducing cases helps relieve pressure on the hospital system and ensure our all important contract tracing efforts (connecting the dots on who has infected who, where and when) so we can prevent unmitigated spread.
When we are in orange, we are in transition. During this time there is still a risk of accelerated spread. Depending on what we are seeing in the community, city facilities may be opened or closed. It may also make sense to open certain low risk facilities (outdoor facilities where social distancing is easy) and keep closed higher risk facilities (indoor close contact where groups congregate) during this time. During the transitional period it is important to look at the trend and rate of change, or how quickly cases seem to be increasing or decreasing. Because cases can rise and fall quickly it is important to look for sustained trends of 7-14 days
When we are in yellow, then city facilities can cautiously open with enhanced safety and cleaning protocols in place. The cases are low enough that hopital capacity is not an issue and contact tracers are able to identify and isolate infected individuals before they can spread the virus.
Click Images to Enlarge


To view which city facilities are open or closed and how to utilize city services visit our City Closures page.

The COVID-19 Symptom Survey was created by the COVID-19 Joint Task Force Data & Analysis Committee to accomplish two goals:
- To provide a tool for Hamilton County area residents to review symptoms commonly associated with COVID-19, especially if they or someone they are caring for, are feeling ill.
- To provide an additional level of anonymized information, beyond coronavirus testing data, to local medical professionals, researchers, and decision-makers for review and analysis. This data will provide another view of the way the virus is potentially spreading in our community.
Understanding how this virus is moving throughout our community helps decision makers develop strategies and command resources to combat the virus and eventually stop its spread. You can check out the survey - available in English and Spanish.

In collaboration with researchers at MIT, Harvard, and Brigham and Women’s Hospital, Biobot Analytics launched a pro-bono campaign to analyze sewage from wastewater treatment facilities across the United States to estimate the prevalence of COVID-19 infection. Since launching on March 23, 2020, the campaign processes weekly samples from 350 treatment facilities in over 40 states. The City of Chattanooga Moccasin Bend Wastewater Treatment Facility was one of the 350 plants chosen from across the country to participate in the study.
After receiving impressive initial reports from Biobot Analytics, the City of Chattanooga entered into a year long contract with the company in June 2020 to continue studying the prevalence of COVID-19 infection in our area.
The interceptor sewer system encompasses approximately 1,263 miles of sewer lines, 7 large custom-built pumping stations, 8 custom-built storm stations, 53 underground, wetwell mounted, submersible pumping stations, approximately 171 residential/grinder stations, 8 combined sewer overflow (CSO) facilities and one major regional wastewater treatment plant at Moccasin Bend.
The Moccasin Bend Waste Water Treatment Plant serves the City and a surrounding metropolitan area which together have a population of approximately 400,000, encompassing about 200 miles. In addition to the City, the system serves the following areas: City of Collegedale, Tennessee; part of Hixson Utility District service area in Hamilton County, Tennessee; City of Red Bank, Tennessee; City of East Ridge, Tennessee; City of Soddy Daisy, Tennessee; City of Rossville, Georgia; City of Fort Oglethorpe, Georgia; Town of Lookout Mountain, Tennessee; Lookout Mountain, Georgia and portions of Walker County and Catoosa County, Georgia.
Data from these reports should be interpreted as prevalence from a wider footprint that one county or municipality. With these reports, the City of Chattanooga hopes to provide an additional tool to decision makers and the public to understand the prevalence and spread of the virus in our community.
Biobot collects samples biweekly from Moccasin Bend and the July 7 and July 21 samples shows that at those points in time an estimated prevalence rate of more than 8,000 people were infected with COVID-19. This is an increase from the June report. The below chart shows the Biobot COVID-19 case prevalence estimates for all sample dates.
